 Estimating the Coefficients
- model:
- prediction error:
- residual sum of squares (RSS) over all observations
- best model:
What is the relationship between and ?
- Mean Squared Error
- Residual Sum of Squares
There is an analytical solution
- to find the parameters that have the minimal given the training data ()
You can find the proof in any textbook or wikipedia. Later, we will discuss alternative algorithm to find the solution
Same Data, different Solutions
- red: true relationship of the simulated data
- grey: random sample drawn from the true relationship
- blue: estimated regressions lines based on different samples (training sets)
- How sure can we be about the values of and ?
Standard Error
- is a measure for the average amount that an estimate (e.g., ) differs from the actual value of and depends on the variance in the data and the number of observations on the sample
- where is the standard deviation of each of the realizations of
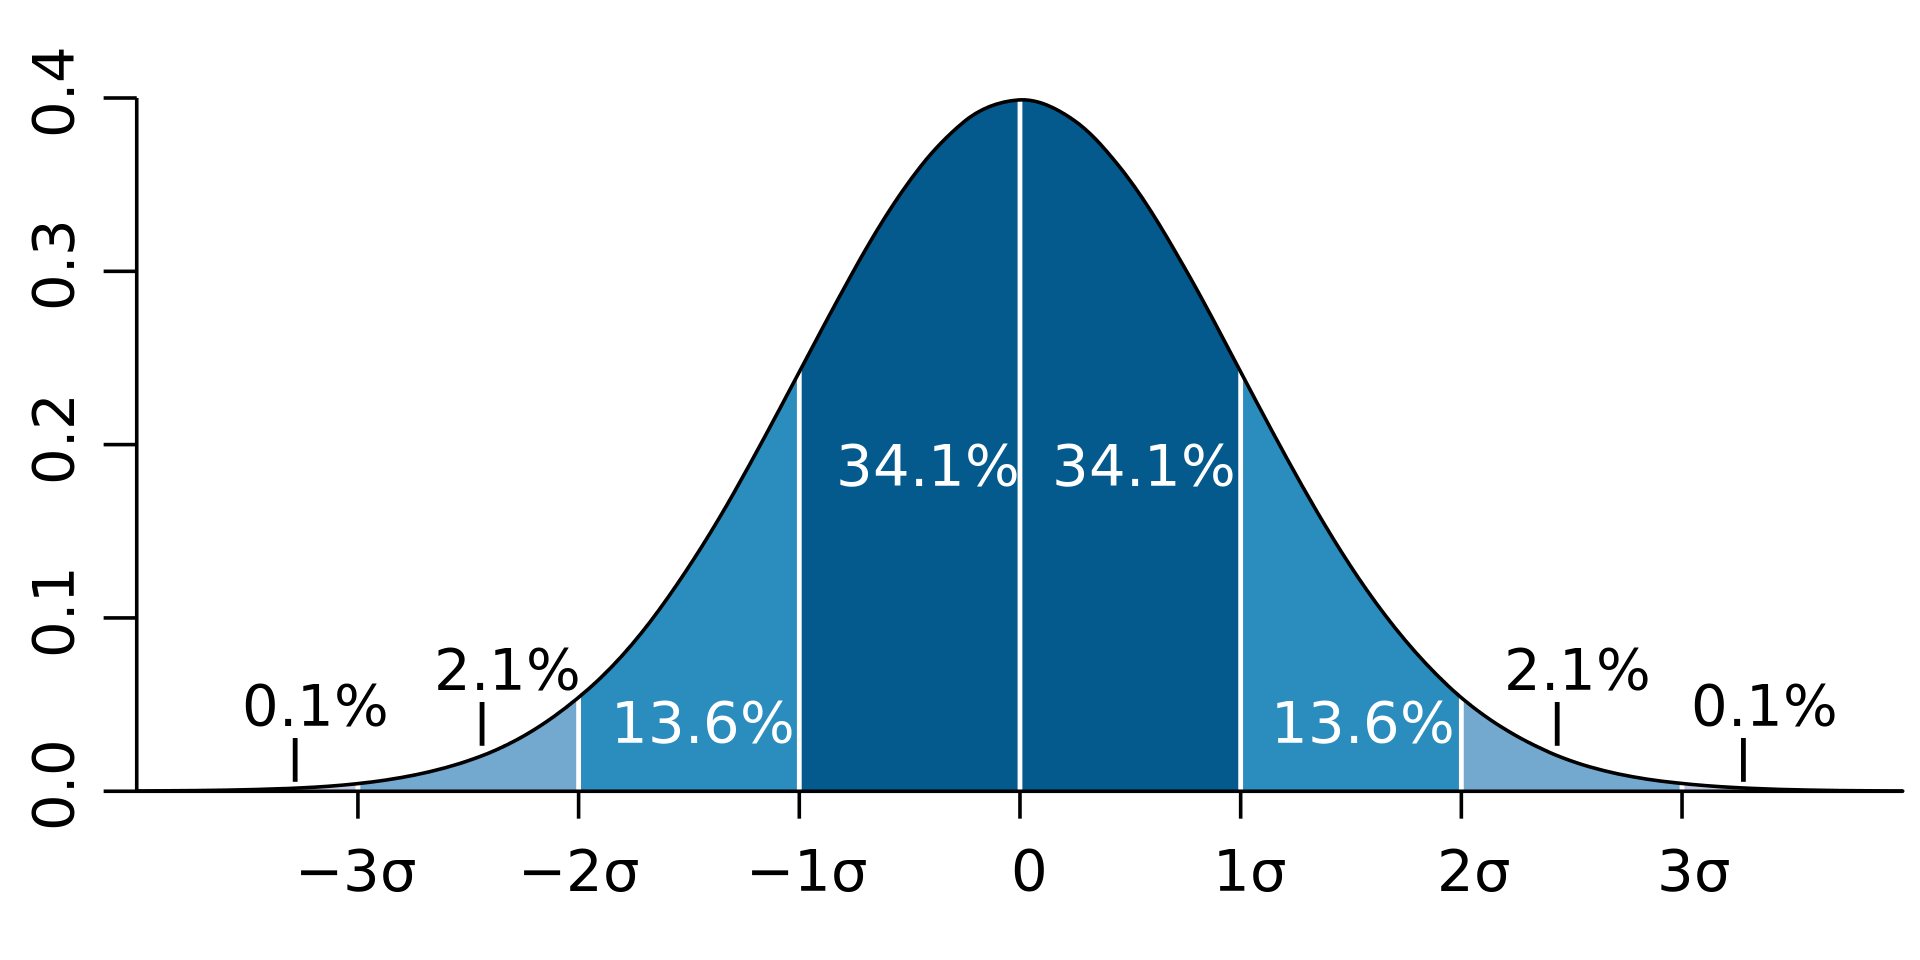
there is approximately a 95% chance that the interval
will contain the true value of . (given a large enough sample size and normal distributed errors)- This is used as a confidence interval.
Normal Distribution
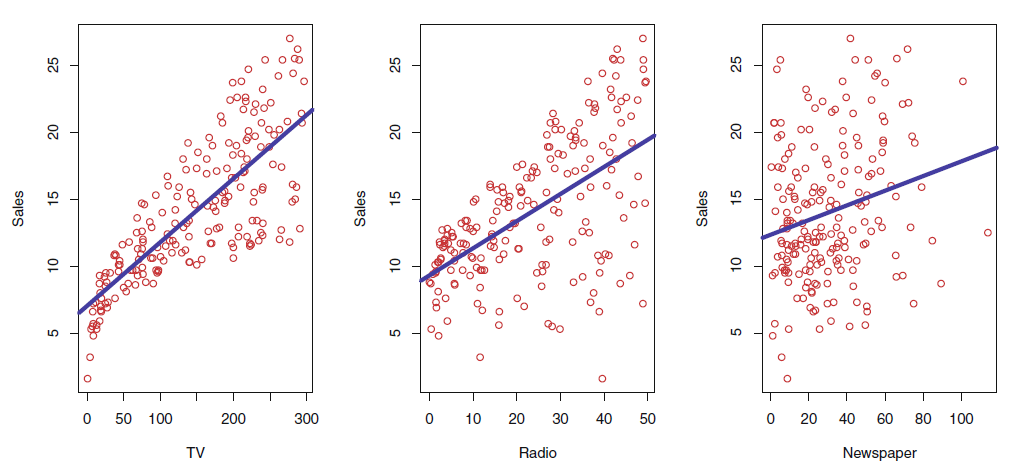
Example TV advertising data
-
confidence interval for
-
confidence interval for
-
without any advertising, sales will, on average, fall between and units.
-
for each $ increase in TV advertising, there will be an average increase in sales of between and units.
Hypothesis Tests in on Parameters
Is there really a influence of advertising on sales?
- : There is no relationship between and
- : There is some relationship between and
 Is far enough from that we can reject ?
- From the data we know / can calculate:
- So, we are pretty sure that the real is in
- how sure are we?
- based on the more then
- We can use a t-Test to calculate, how likely it is have a of given our data:
-
https://www.geogebra.org/m/b85v7zww,
- the probability of observing a or , given the real is very low
- we call this probability the -value
- a small p-value indicates that it is unlikely to observe such a substantial association between the predictor and response due to chance
- We reject the null hypothesis — that is, we declare a relationship to exist between and — if the -value is small enough (usually )
 Regression Tables
After fitting the model, the models parameters can be found in a regression table.

- ,
- ,
- as , we say: TV adds have a significant positive correlation with sales
Real Regression Tables
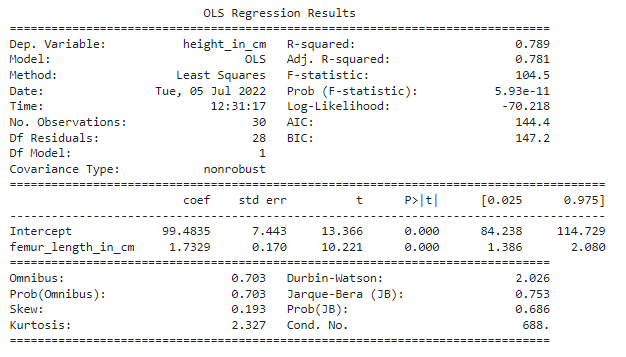
- what is the predicted variable?
- how large is the intercept?
- is there a significant influence of femur length on the predicted variable?
OLS - Ordinary least squares = Regular Linear Regression
Assessing the Accuracy of the Model
Does the model fit the data?
 Residual Standard Error
- There will always be an error , even if we know and perfectly
- Residual Standard Error () is an estimate of the standard deviation of
- average amount that the response will deviate from the true regression line
- ... perfect fit

even if the model was correct and the true values of the unknown coefficients and were known exactly, any prediction of sales on the basis of TV advertising would still be off by about units on average.
 Statistic
- provides an absolute measure of the fit (e.g., units)
- provides a proportion between and
- where is the total sum of squares
- where is the sample mean
- measures the proportion of variability in that can be explained using and the linear model (instead of just using the sample mean)
- : regression did not explain much of the variability in the response
- in the TV-example : two-thirds of the variability in sales is explained by a linear regression on TV
 Interpretation of
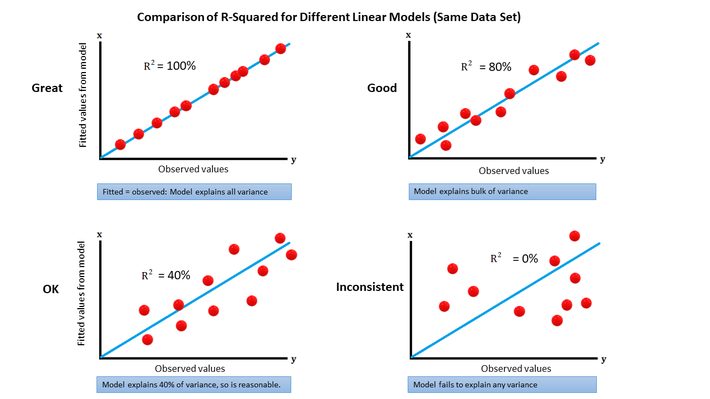
https://www.datasciencecentral.com/wp-content/uploads/2021/10/2742052271.jpg
Be careful!
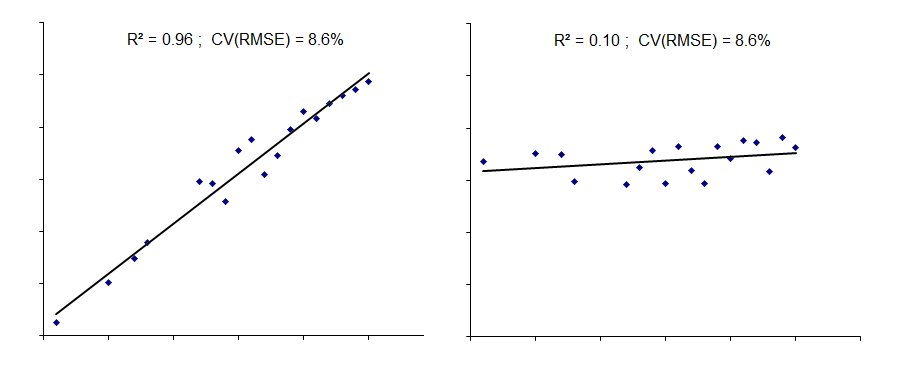
- no good measure for prediction accuracy!
- or is identical, still is very different
- Especially as it is calculated on the test set
https://www.enmanreg.org/r2/r2_vs_cvrmse/

 Case Study

https://ocean.si.edu/ocean-life/seabirds/penguins
- Is there any relationship between two variables (for any species and penguin), where You do not expect a linear correlation?
- If so (or not), is the model a good predictor?
35 minutes